How to display a graph in Excel with two axes and different units (Excel 2019)
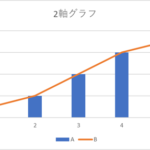
When you are creating a document, do you ever want to create a graph with two axes like the one in the figure above?
Why don't you use useful tools and programs to make your work easier?
When you are creating a document, do you ever want to create a graph with two axes like the one in the figure above?